
Exploration of Differences in Professional Disc Golf Divisions
An exploration of the differences between the Mixed Professional Open(MPO) and Female Professional Open(FPO) in the sport of Disc Golf.
There has been constant discourse on the topic of Disc Golf’s main two divisions. This discourse has mostly centered around making the FPO division equal to the MPO division in terms of money, coverage, and difficulty of the courses. With the data collected from my last blog, I hope to gain some rudimentary insights into this issue. The goal of this blog is to perform an exploratory data analysis in order to find points of interest in the data. The first step is to look at the variables and some number summaries.
Variables and Number Summaries
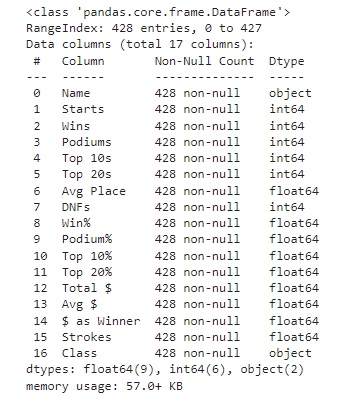
Below is a table of all variables with their type and number of entries. It’s smart to look at this type of breakdown first and see what you’re working with in terms of variables. Also make sure all variables are of the desired data types.
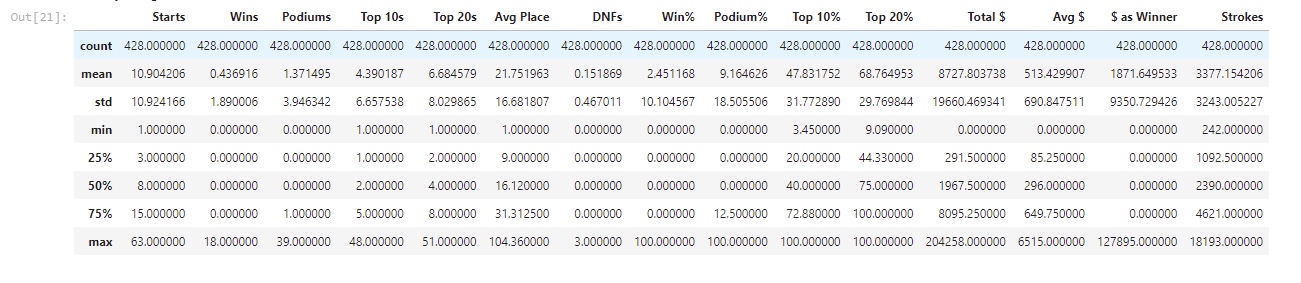
Next, we look at a numerical summary for each variable. This gives us a good peak into the data we’re working with. From our summaries we can see many signs of skewness in our data. Most variables seem to be heavily right skewed, but that ok we expect that with performance data like this.
Variable Relationships
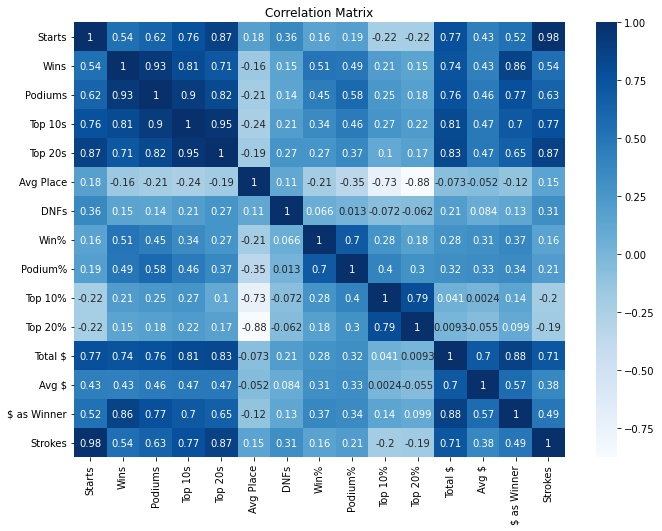
The next step in the EDA process is to examine relationships between variables. Since the majority of our variables are numeric, it’s a no brainer to create a correlation matrix. A correlation matrix puts every variable against each other and calculates a correlation coefficient for each combination of variables. The result is a matrix that can be easily scanned for significant relationships between variables. This is a great first step for a regression analysis. From this matrix we can see that most relationships are what we would expect. For example, the top 10% and 20% being correlated with winning makes sense.
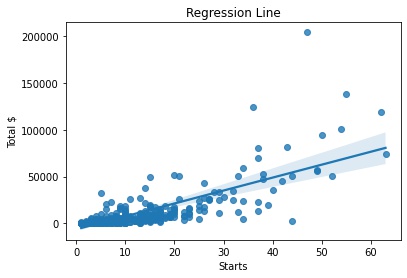
Using the information from the correlation matrix, we can test out a few regression lines. For this first one we can see a positive correlation between the number of starts and total money earned. The relationship seems to be decently positive and linear, but the clustering at the start is a sign of skewness.
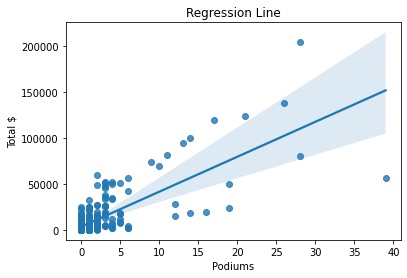
This next regression line is similar to the first, but the line seems to be even worse with clustering. So far, in terms of regression models, our data does not seem like it’s going to work very well.
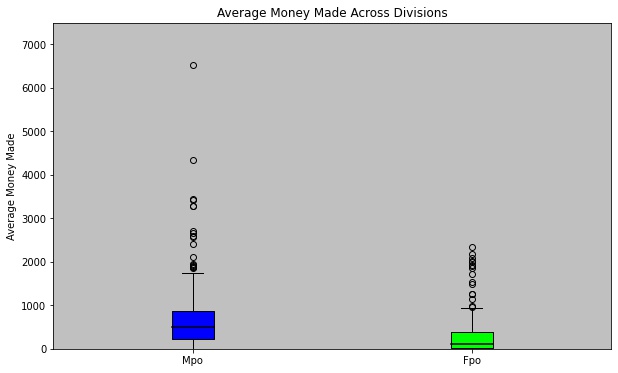
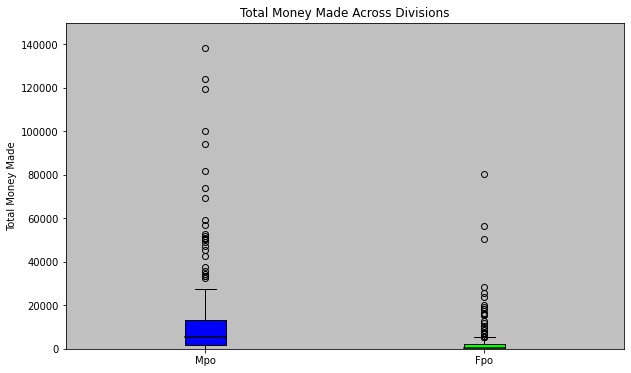
What about our categorical variable? since we only have one, we’re interested in, it’s a good idea to just try out some variables of interest. Below we can see the differences in the average and total money made by the MPO and FPO Divisions. Both of these graphs show signs that there are significant differences in the prize money across the divisions. This data gives enough evidence to show it is worth looking into this further.
Conclusion
This EDA has been successful in some respects, but it has also brought up some significant limitations of the data. On one hand we can see clear differences in the amount of money made by MPO and FPO divisions, but the data is much too broad for use to dive deep into the issue. The data is also not descriptive enough to do any analysis on what contributes to players winning tournaments. The EDA has been successful in motivating further analysis, and we are now more aware of the type of data we need. Hopefully the next blog will have a new, more descriptive data set to dive deeper into. I look forward to seeing you then.
Repository for data and code: https://github.com/austinC58/STAT386WebScrapingAssignment.git